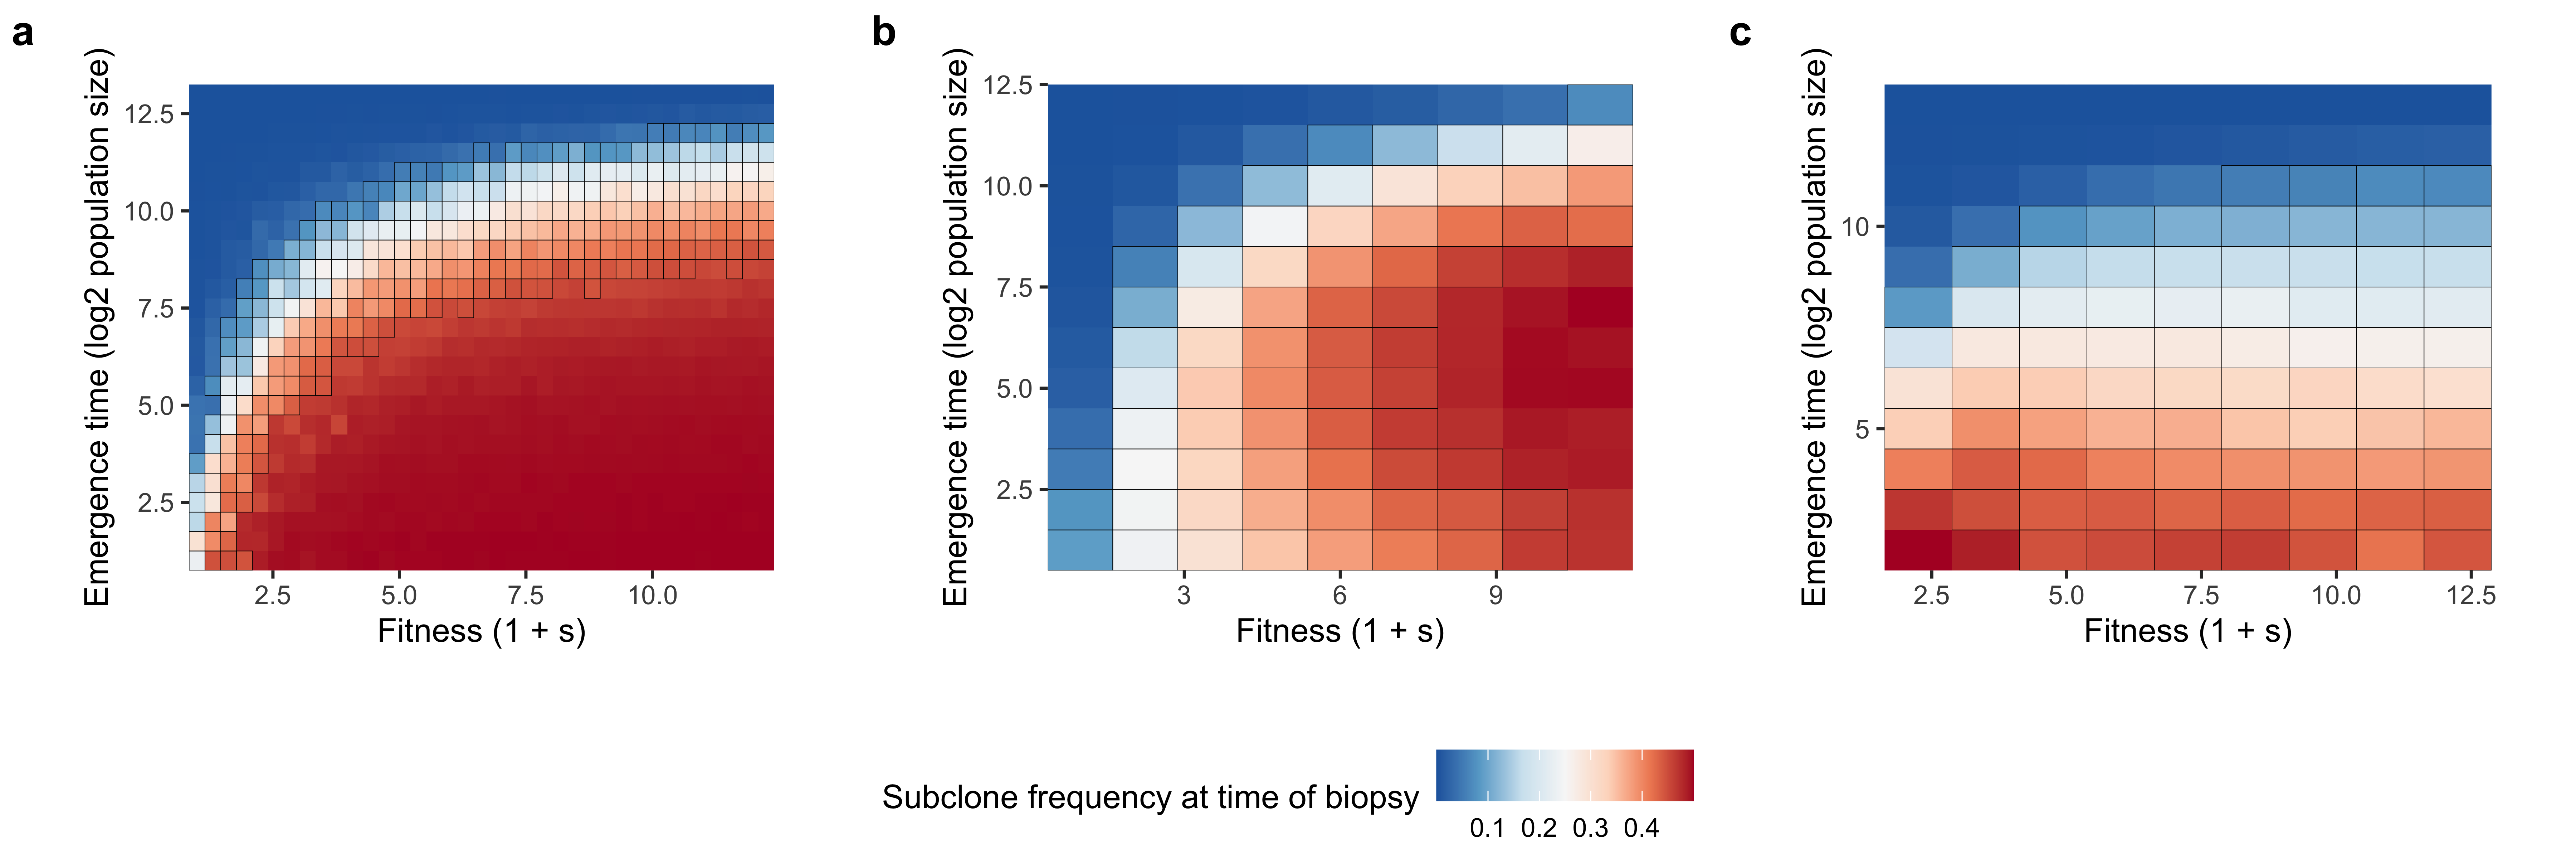
Supplementary Figure 20. Viable fitness and emergence time parameter combinations for detectable subclones (~10 - 40% VAF) in the TEMULATOR simulation framework Before generating a complete synthetic dataset, we examined the subclone fitness and emergence time that led to detectable subclone frequencings using the TEMULATOR simulation framework. Synthetic tumours were initialized with 500 clonal mutations and then simulated at a birth, death, and mutation rate of 1, 0.2, and 20 to a final population size of 10,000 cells. Mean sequencing depth was set to 100x and sequencing noise was generated under a beta-binomial model. (a) Subclone frequencies at varying fitness and emergence time combinations in the 1 subclone setting. (b,c) Subclone frequencies at varying fitness and emergence time combinations in the 2 subclone setting where the latest arising subclone is (b) and the earliest arising subclone is c. We note that we only consider the 1 subclone case when validating the transfer learning approach in this paper.
Supplementary Figure 21. Comparison of predictive performance for inferring evolutionary parameters with and without pre-trained TumE models. To exhibit the benefit of using pre-trained models when performing related evolutionary inference tasks, we evaluated the mean percentage error for predicting four TEMULATOR parameters/variables in a test set of 400,000 synthetic tumours. Non-pretrained models (False) and models with pre-trained convolutional layers (True) were trained on 500,000 synthetic TEMULATOR tumours for a maximum of 10 epochs. Hyperparameters (number of fully connected layers in new task specific branches and learning rate) were tuned via random search. Predictions for each model (38 non-pretrained & 33 pre-trained) were made across 50 sequencing depth and mutation rate combinations (e.g. 100 depth and 50-100 mutations per genome per division; n = 1900 & n = 1650). .
Supplementary Figure 22. Evaluating the relationship between training set size and neural network model performance in a holdout test set of 500,000 synthetic tumours. (top row) (Top row) Distribution of mean absolute percentage error (MAPE) versus training set size with 100 models generated via random hyperparameter search per training set size. Each model was evaluated in 500,000 synthetic tumours simulated at mean sequencing depths of 75 - 200 and mutation rates ranging from 0 - 500 mutations / genome / division. Only synthetic tumours containing a subclone between 20 - 80% subclone cellular fraction were included. (Bottom row) Evaluating MAPE in the top model (based on minimizing MAPE) from each training set size. For each model, MAPE was computed across 300 subclone cellular fraction (0.2 - 0.8, step 0.1), mutation rate (0 - 500, step 50), and sequencing depth (75, 100, 125, 150, and 200) combinations.
Supplementary Figure 23. Comparison of mean percentage error with and without post-hoc mutation rate correction. (a) We observed a modest but systematic underestimate of mutation rate following model training (as obseved in the positive mean percentage error). To correct this underestimate, we fit the outputted mutation rate estimates with a polynomial regression (degree 2) to predict the true mutation rate in a training set of 1000 synthetic tumours. (b) We then validated the correction in a holdout set of 100,000 synthetic tumours. The correction properly adjusted the majority of mutation rate estimates although lower mutation rates remained reasonable but underestimated. The labels on right axis of each plot indicate mean sequencing depth.
Supplementary Figure 24. Mean percentage error for inferring parameters from TEMULATOR simulations (mutation rate, subclone cellular fraction, subclone emergence time, and subclone fitness). Mean percentage error for predicting mutation rate (per genome per division), subclone cellular fraction, subclone fitness (1 + s), and subclone emergence time (in tumour doublings) with top performing TumE transfer learning model. The labels on the right axis of each plot indicate mean sequencing depth.