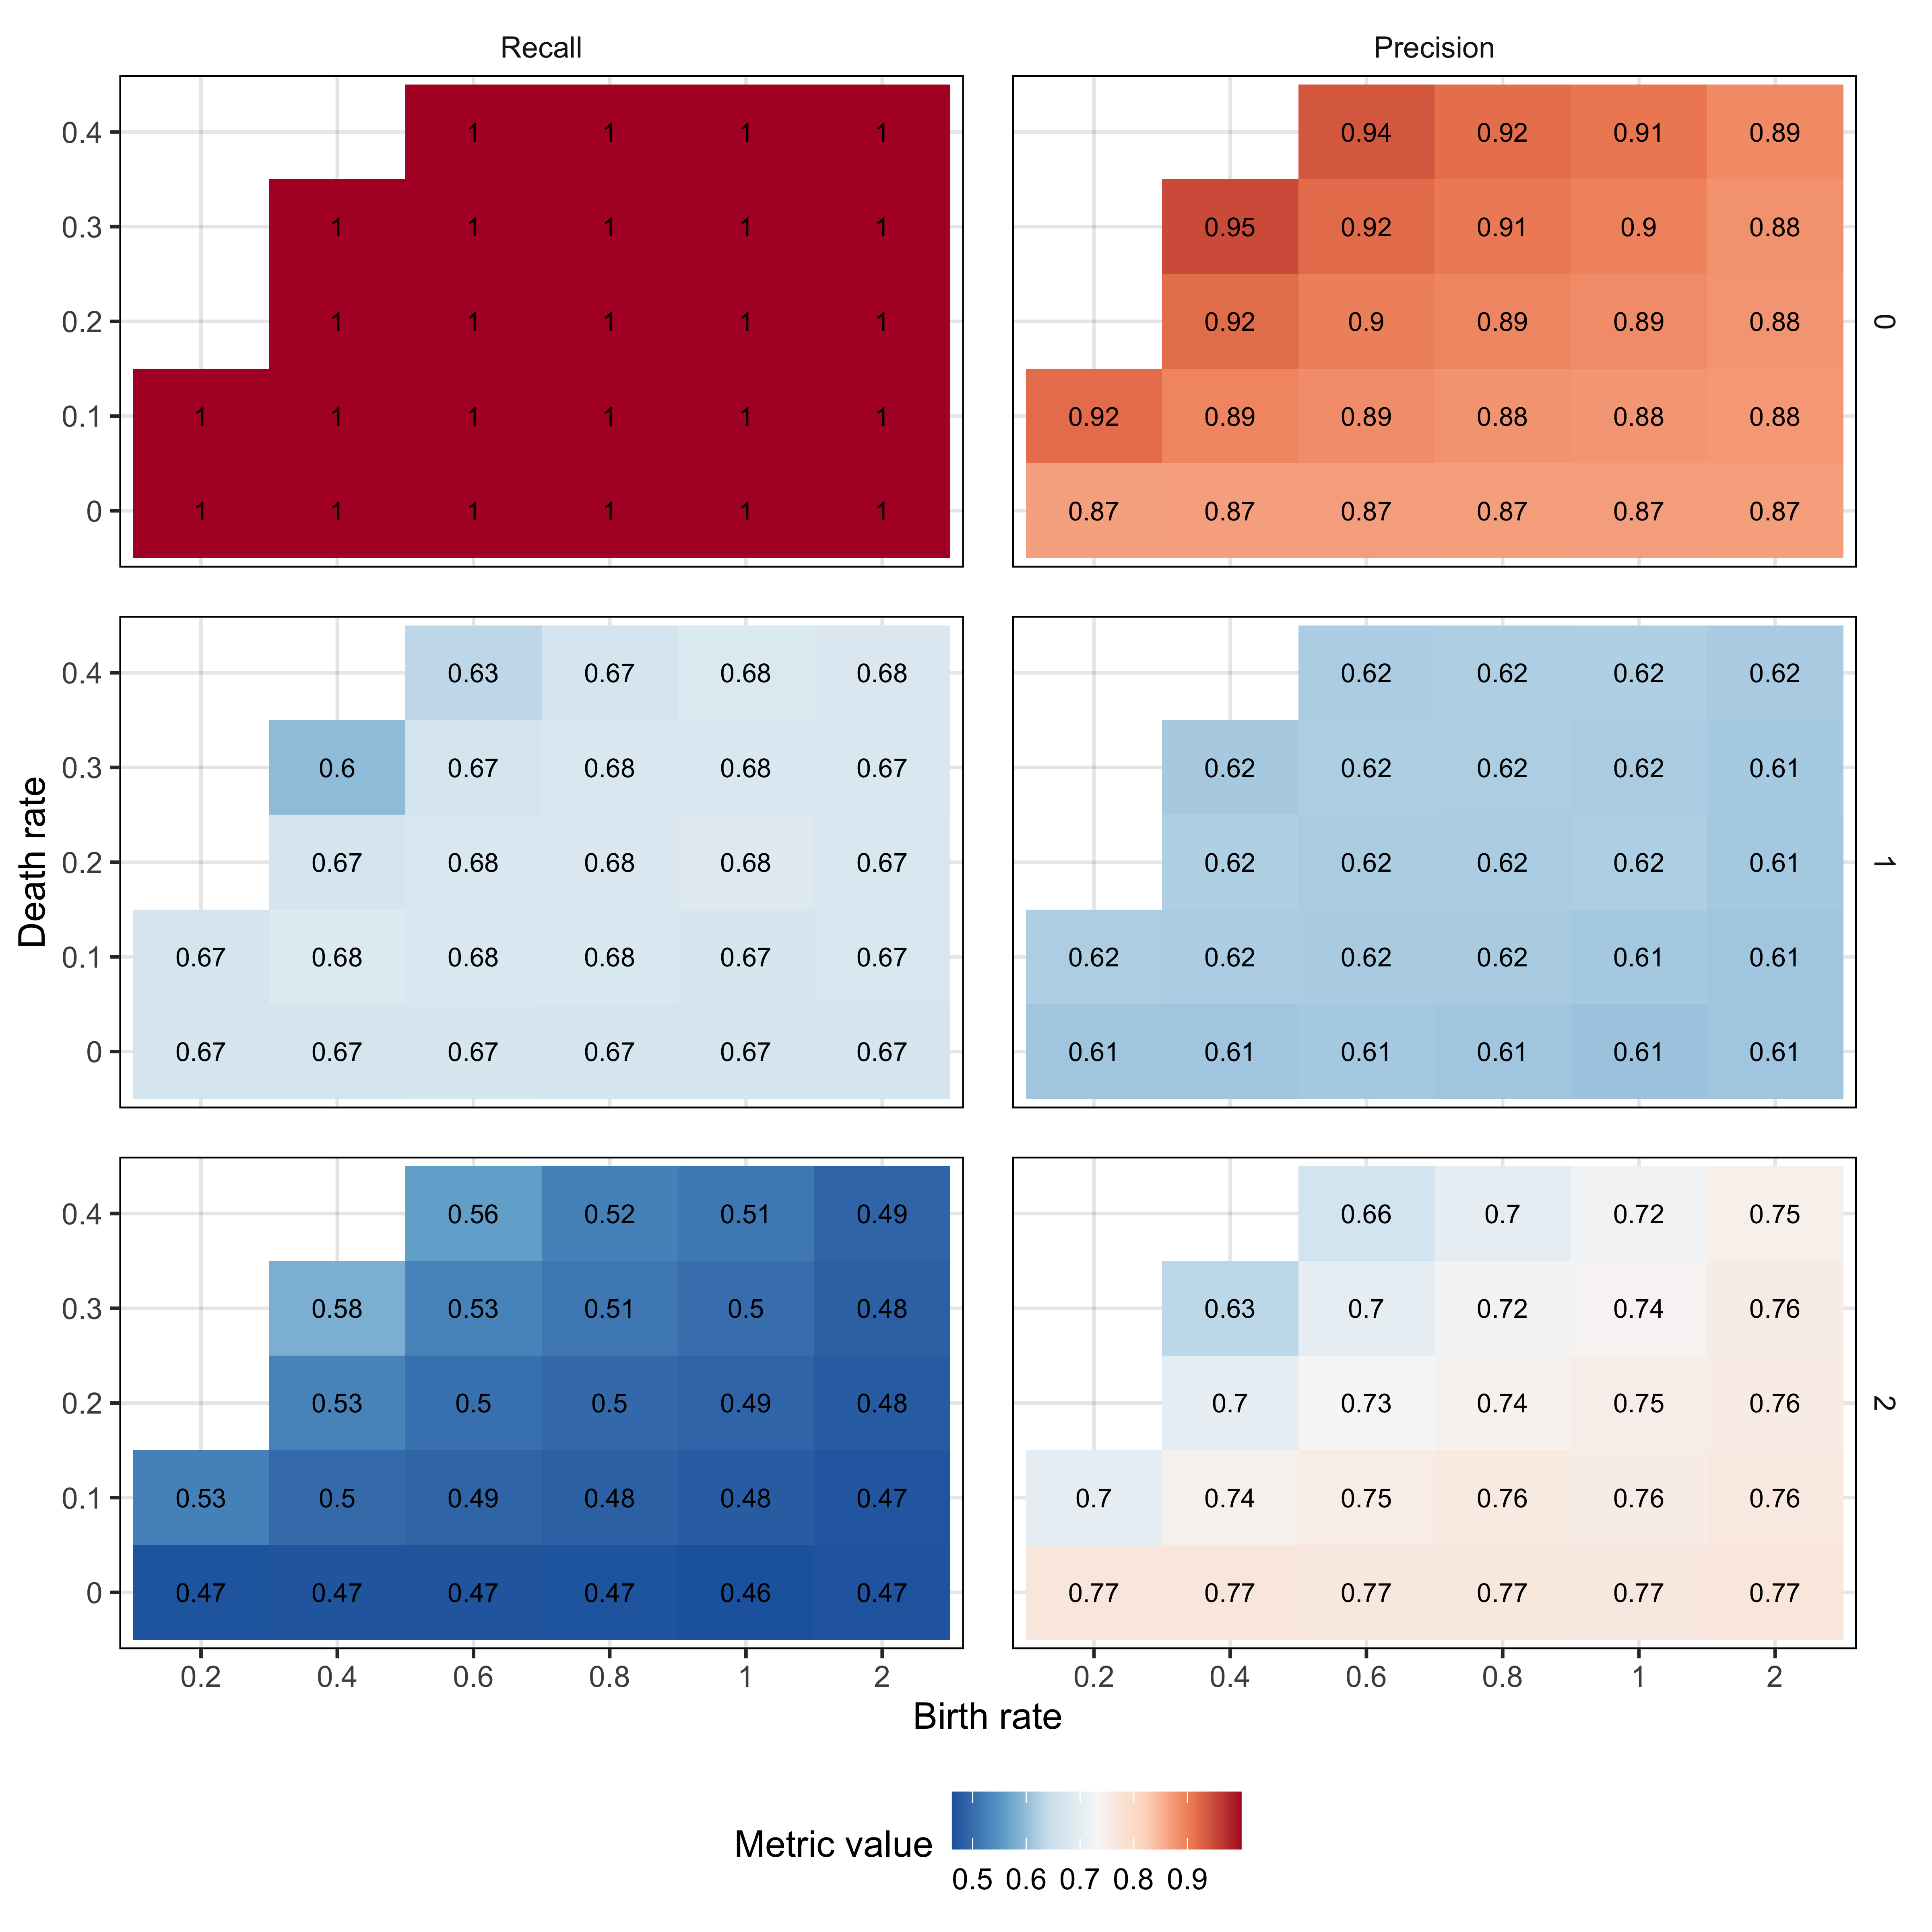
Supplementary Figure 15. TumE performance (precision and recall) for predicting the number of subclones across 26 different birth rate and death rate combinations in 6.7 million synthetic tumours. We evaluated model performance under different birth rate and death rate combinations as we built our inference models using data generated at a birth rate of log(2) and death rate of 0. We find that our performance is consistent across all birth rate and death rate combinations analyzed, although we are more likely to overestimate two subclones when only one subclone is present at low birth rate and death rate combinations (e.g. birth rate = 0.4 and death rate = 0.3). This is likely due to a flattening of the neutral tail at lower growth rates, and leading to a relative excess of mutations within the subclonal frequency range. However, birth rate and death rates defined in terms of beta values (probability of a cell division producing a surviving lineage; [b-d]/b) have been shown to be >0.3 for all cancers (Werner et al., 2020) (b = 0.4 and d = 0.3 gives a beta of 0.25), suggesting our estimates are robust to birth-death combinations likely observed in real patient tumours.
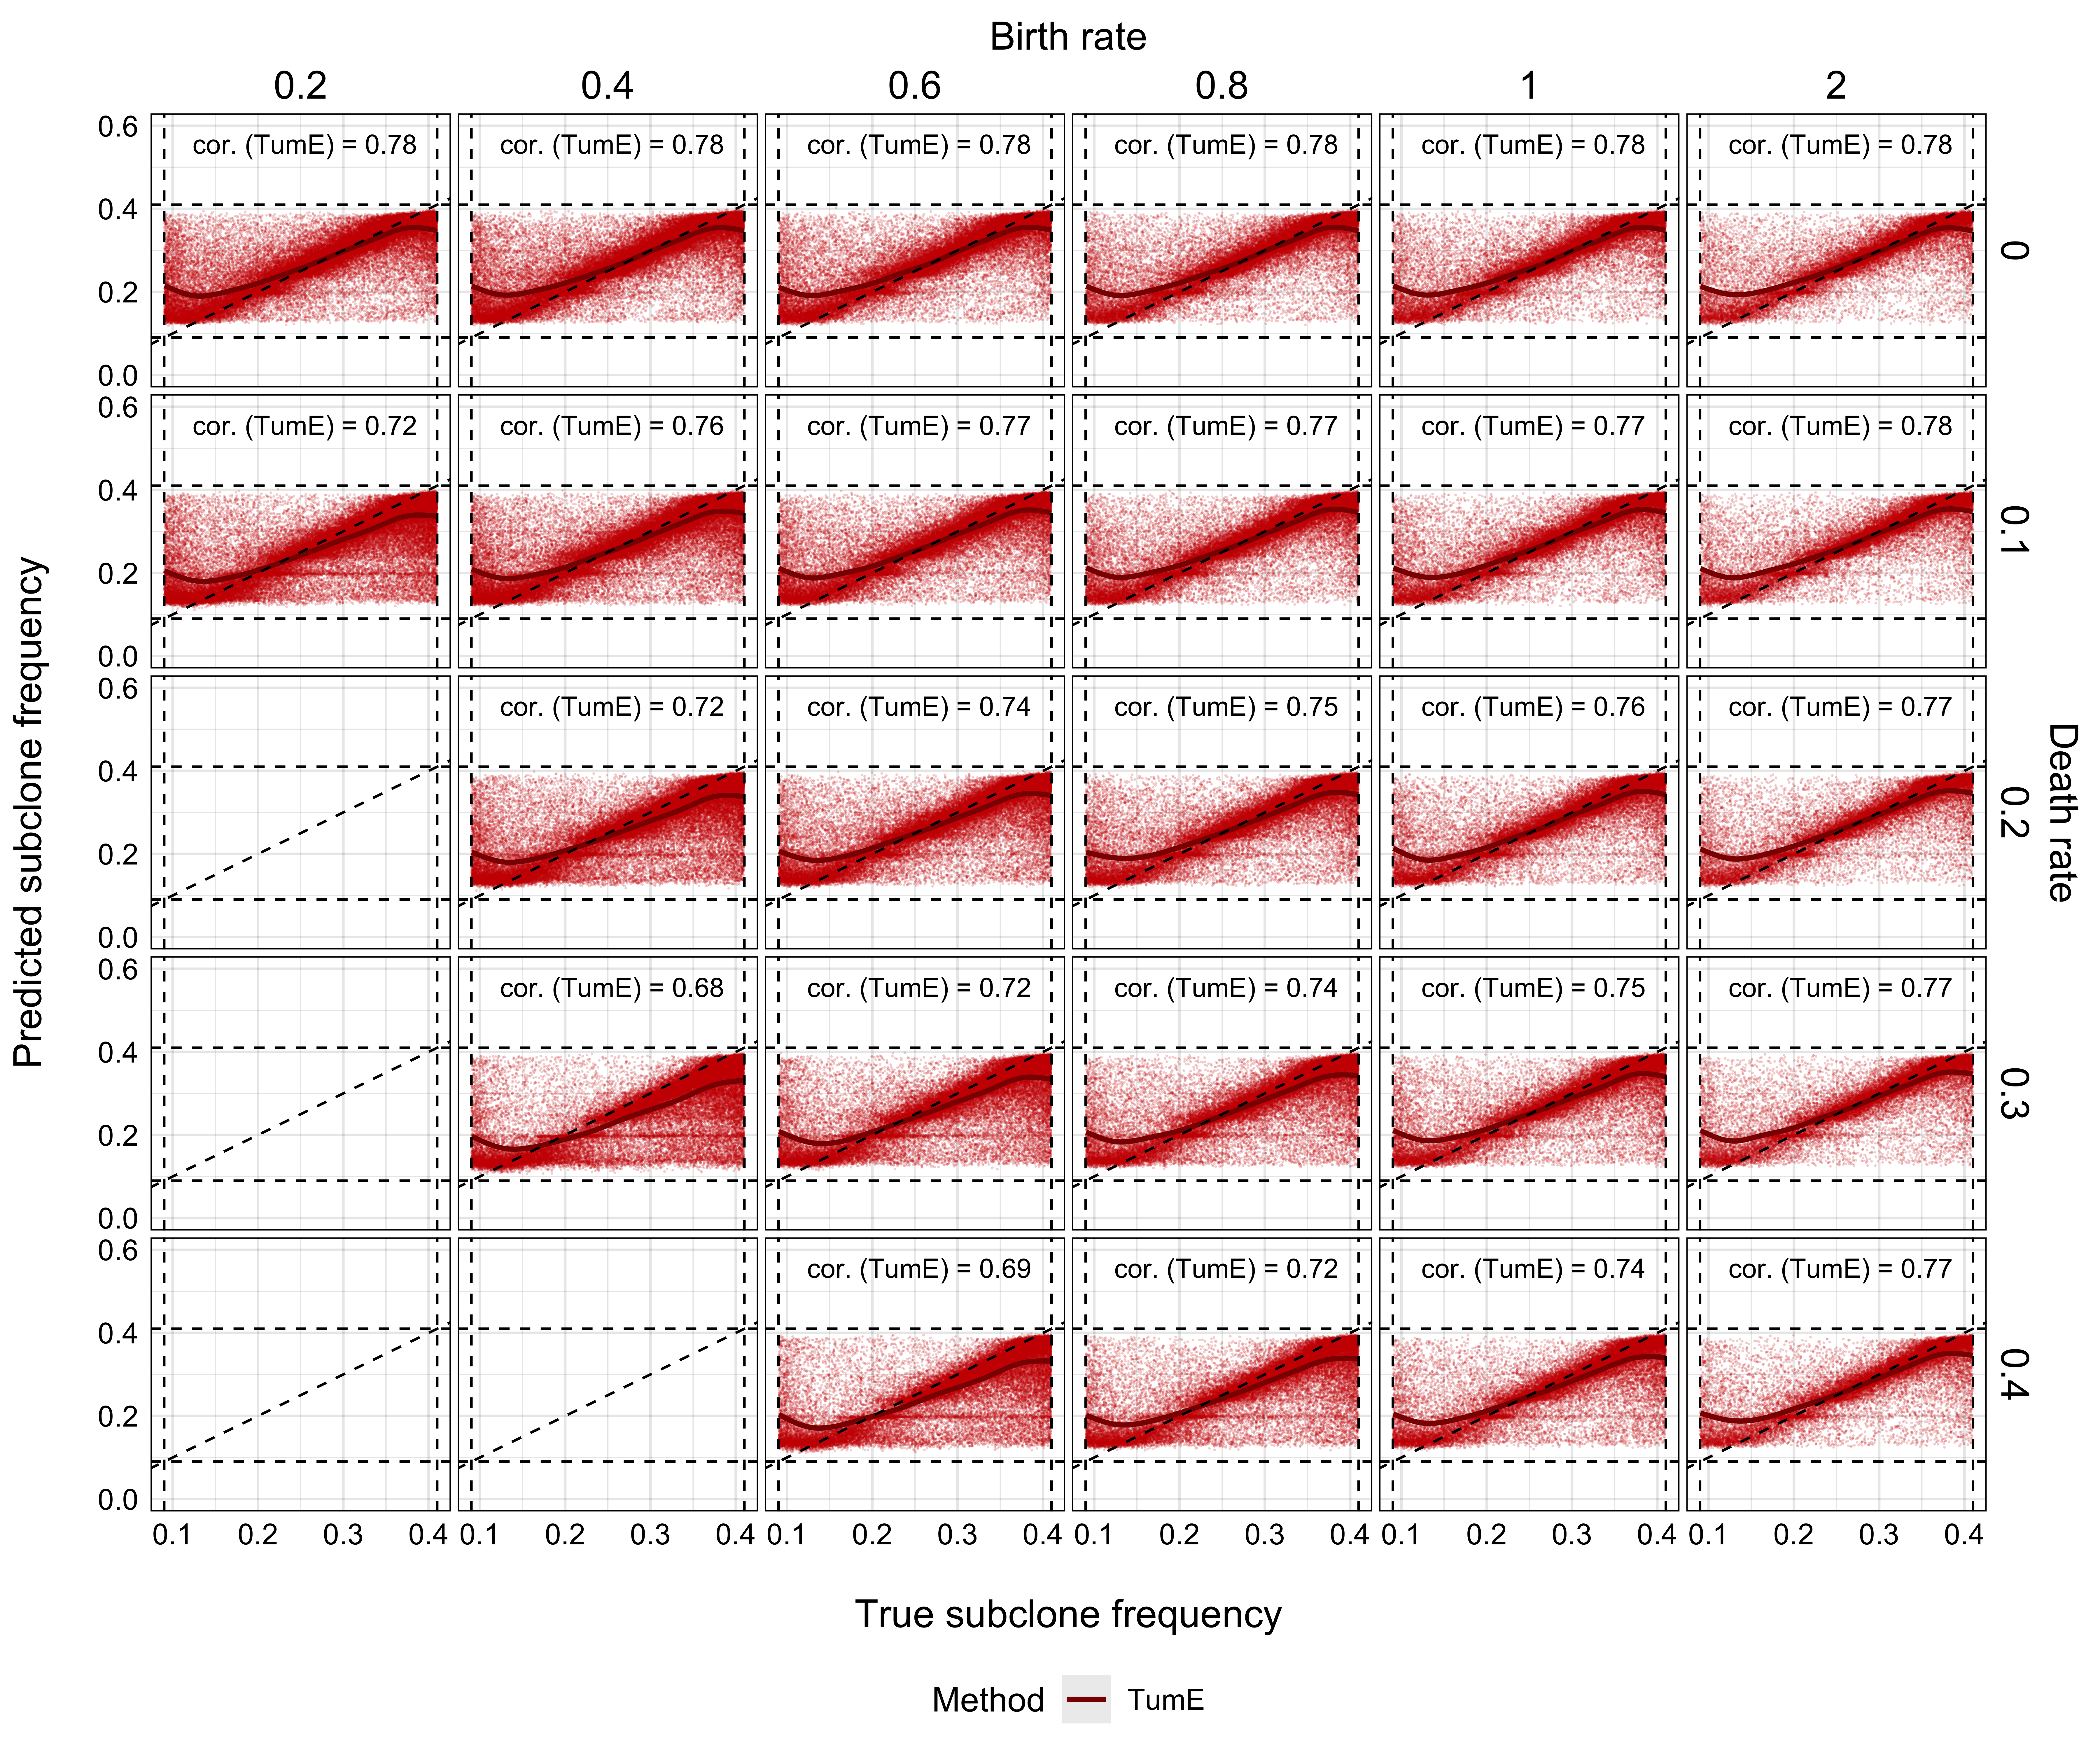
Supplementary Figure 16. TumE performance (precision and recall) for predicting the frequency of a single subclone across 26 different birth rate and death rate combinations in 6.7 million synthetic tumours. We evaluated model performance under different birth rate and death rate combinations as we built our inference models using data generated at a birth rate of log(2) and death rate of 0. We find that our performance is consistent across all birth rate and death rate combinations analyzed. Correlation between true and predicted subclone frequency provided in top right corner of each facet. .